Last Friday I was fortunate enough to present on Webpage Speed, Latency & some Technical SEO at the GDMS e4 Conference with Andy Lindstrom. I’ll summarize what the discussion was about below, and provide the slides that were used for our discussion.
Page Load Speed Is An Essential Foundational Piece For Your SEO
Everyone appreciates a fast webpage. The faster we are able to access our content, the happier we are as web users. It builds trust in the website we are working with when everything runs quickly & seamlessly. Yet, so many websites still don’t work at their optimal speed.
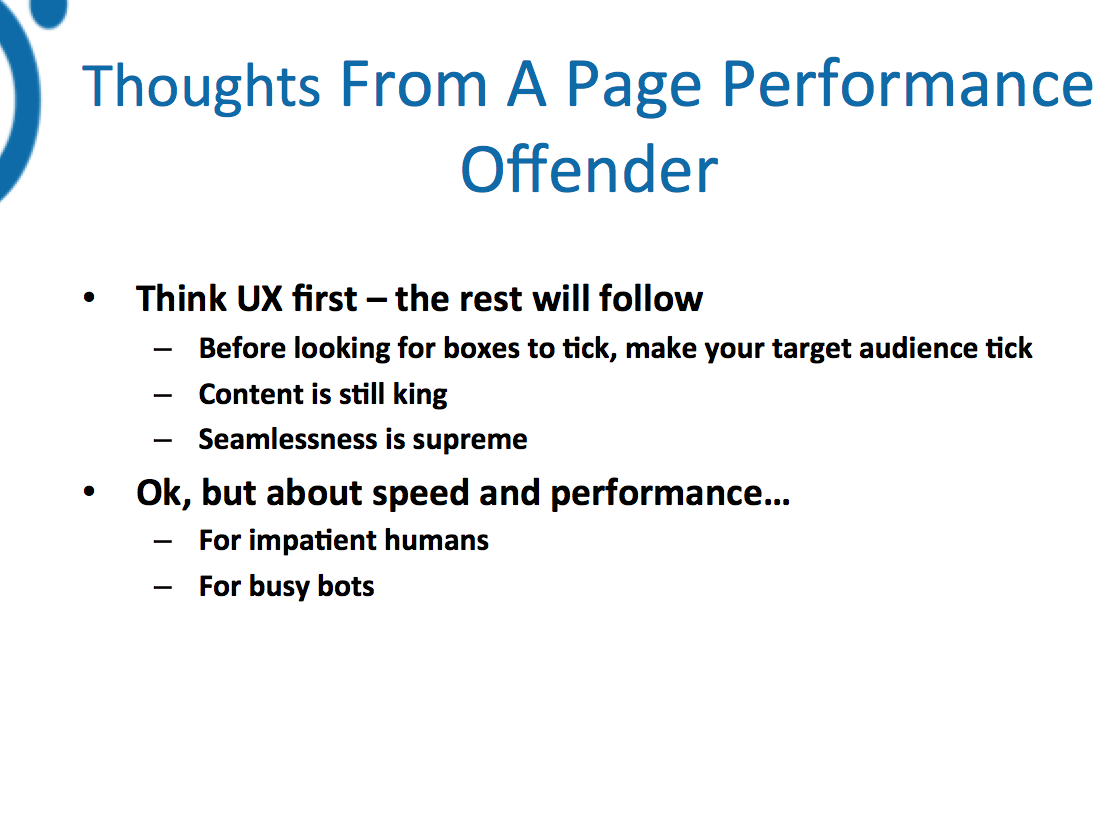
Andy summarized it perfectly in the slide “Thoughts From A Page Performance Offender” below; in addition to UX having faster loading pages is also friendlier on the bots & your crawl budget.
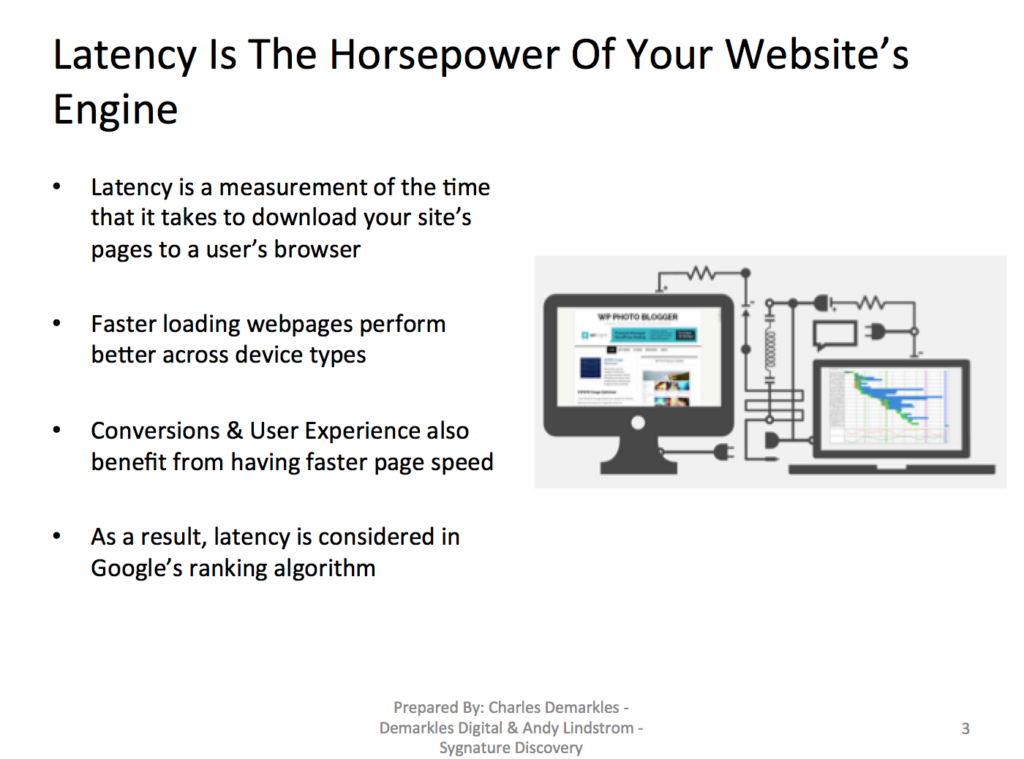
You can think of it as being like the horsepower to your website’s engine; the faster your site performs, the more you can accomplish, regardless of what your goals are.
It impacts your ability to rank, and has become much more of a focal point in the SEO community since the shift to mobile browsing.
Breaking Down How A Webpage Loads
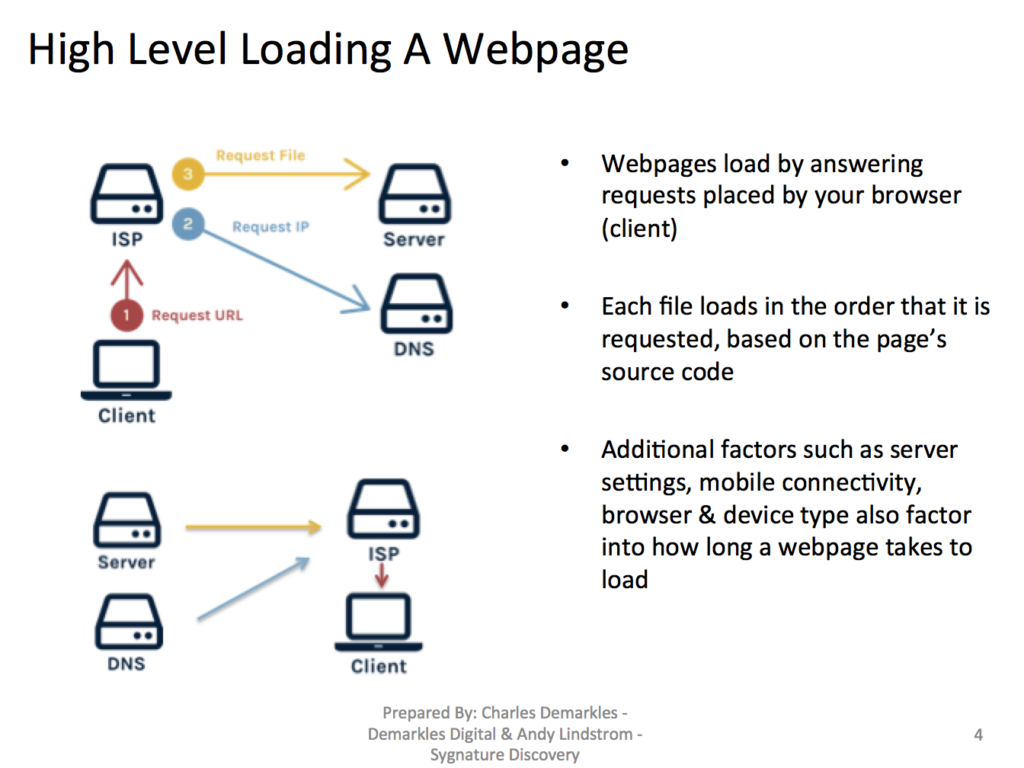
Webpages are loaded using file packets that are constructed by the browser to form the final view that a user enjoys. Before that, the initial requests are placed from the user’s browser/device to the internet service provider, as well as to the hosting server & domain name server in order to properly direct the files to the correct place.
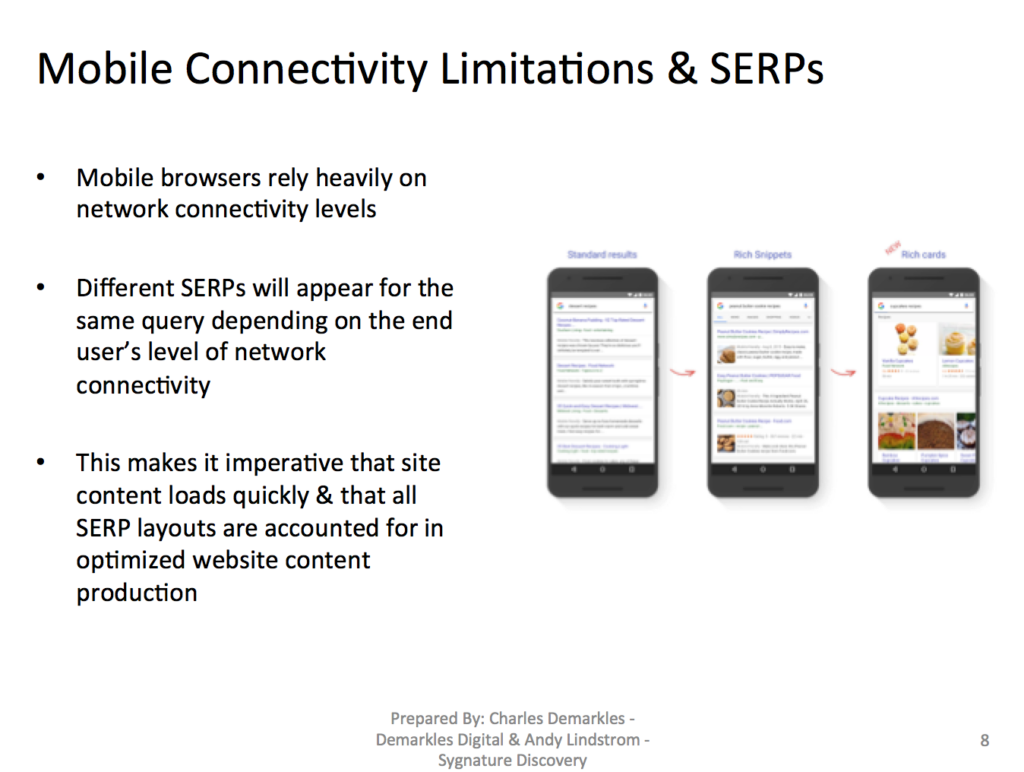
This is a crucial part to consider when making a new site/webpage, as this is where additional factors such as network connectivity & device type all come into play as variables. Even the fastest loading pages won’t load when on a bad connection, and those connectivity levels contribute to what Search Engine Results Page (SERP) layouts an end user will be shown for their query.
Once the connections are established & packets begin being transferred, the file loading sequence takes place, which constructs the final webpage that you view in your browser.
Deep Dive Into Page Load Sequences Using WebPageTest.org’s Waterfall View
WebPageTest.org provides webmasters with a great tool for visualizing how files load on a given webpage. URLs are able to be looked at individually, and can be tested from various global locations, as well as varying mobile network connections. This is especially important for how pages will load from international audiences, as well as how varying network speeds will impact how an end user experiences a page loading.
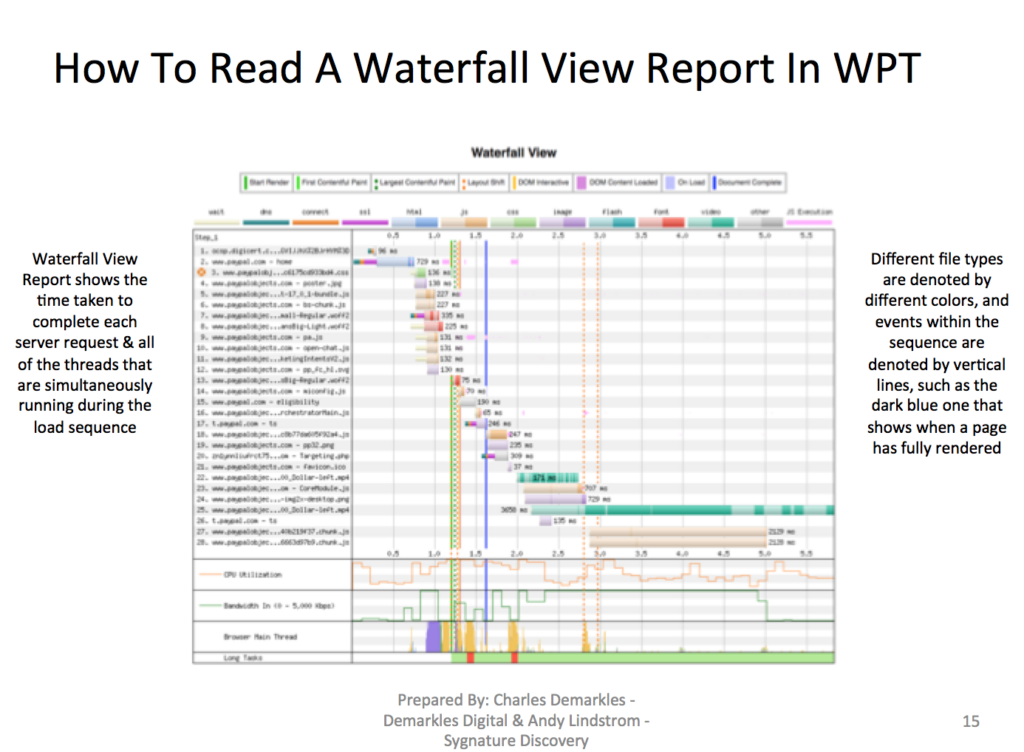
Each file request is broken down into the table shown above, where the time taken to load the page is shown in terms of how long each file takes to load. An interesting part of this is that the vertical blue line shows when the page renders, which is when it shows up from the user’s point of view. This enables webmasters to visualize what files need to be loaded before a page renders vs. after render, which is a common issue most websites (particularly theme/template based ones) experience.
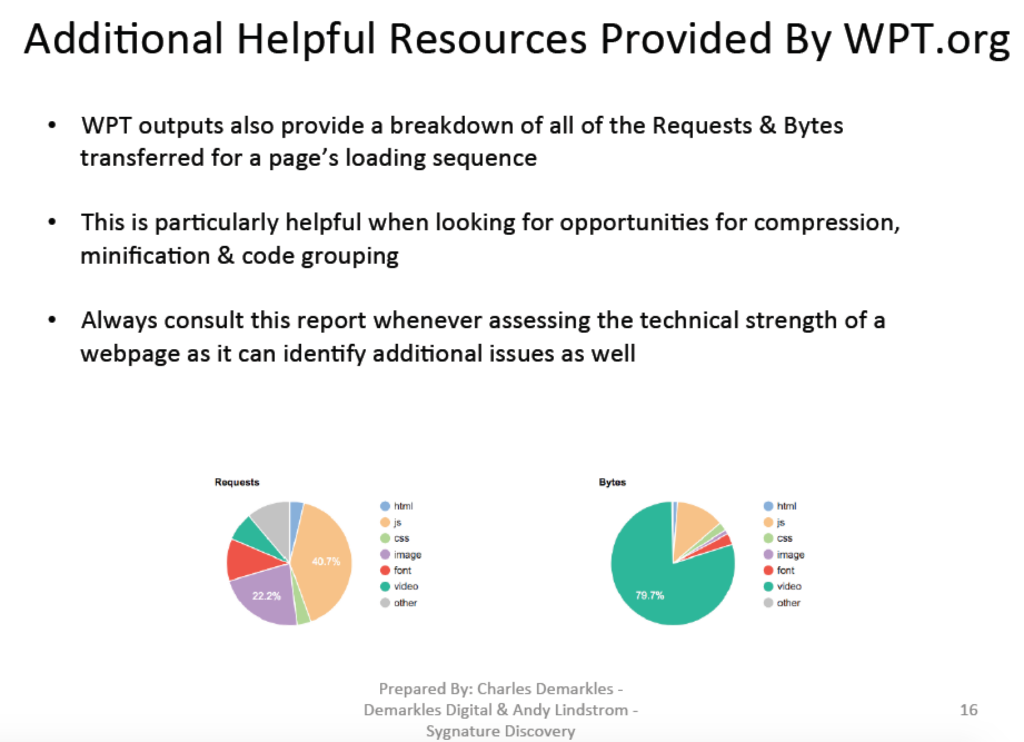
WPT also provides breakdowns of all of the requests by filetype, as well as all bytes transferred by filetype. This is helpful as it can identify opportunities for code compression, as well as for file grouping & minification.
Visualizing How Third Party Cookies Negatively Impact Latency
A hot topic of discussion this year has been how Google Chrome is moving to no longer support third party cookies. While this seems like a surprise to many people, they are following the footsteps of other browsers, such as Firefox or Safari who have not supported them for a while. The reason that this is particularly alarming to many who rely on them for tracking codes etc… is that Chrome is 70-80% of desktop online traffic, so it will impact many end users.
This seems to be a move by Google to force third party analytics sources to make their code/resources Google Tag Manager Friendly, and to force webmasters to remove extra requests from their source code, thereby speeding up websites.
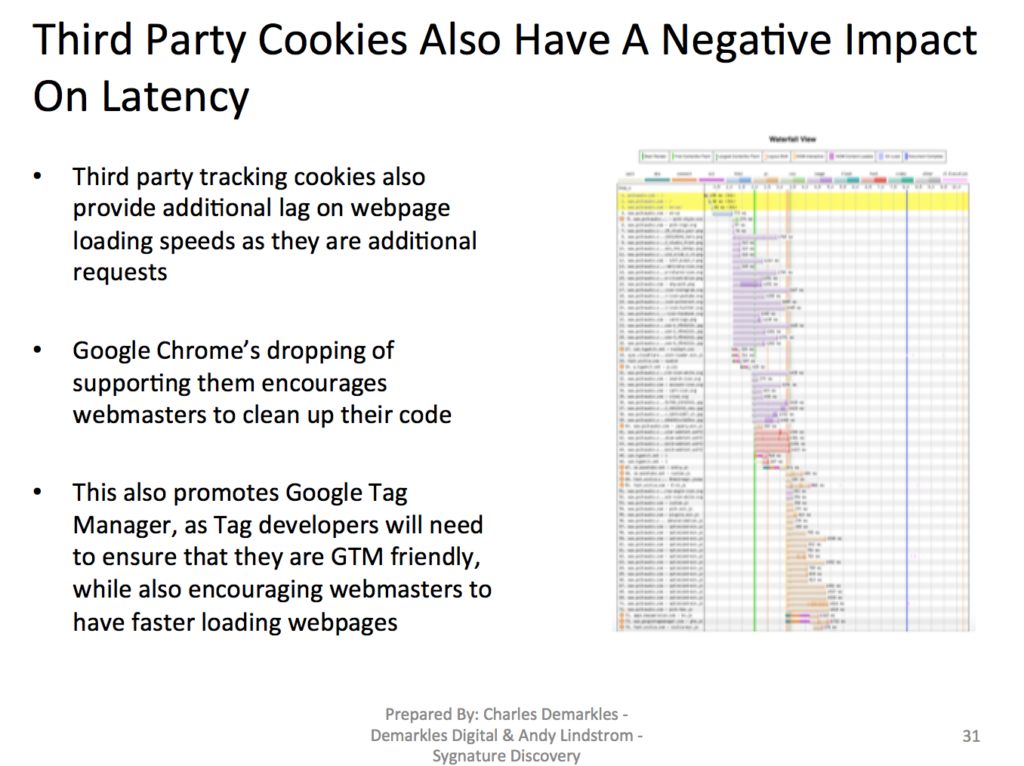
Another common issue that is identified by using the waterfall view is seeing files that result in re-directs. This is problematic is it results in deadweight in your loading sequence. At larger organizations this is common, as marketing departments have many moving pieces that constantly experience turnover/changes, so sometimes code gets grandfathered into a page’s load sequence and will not be removed because no one knows what stakeholder owns it.
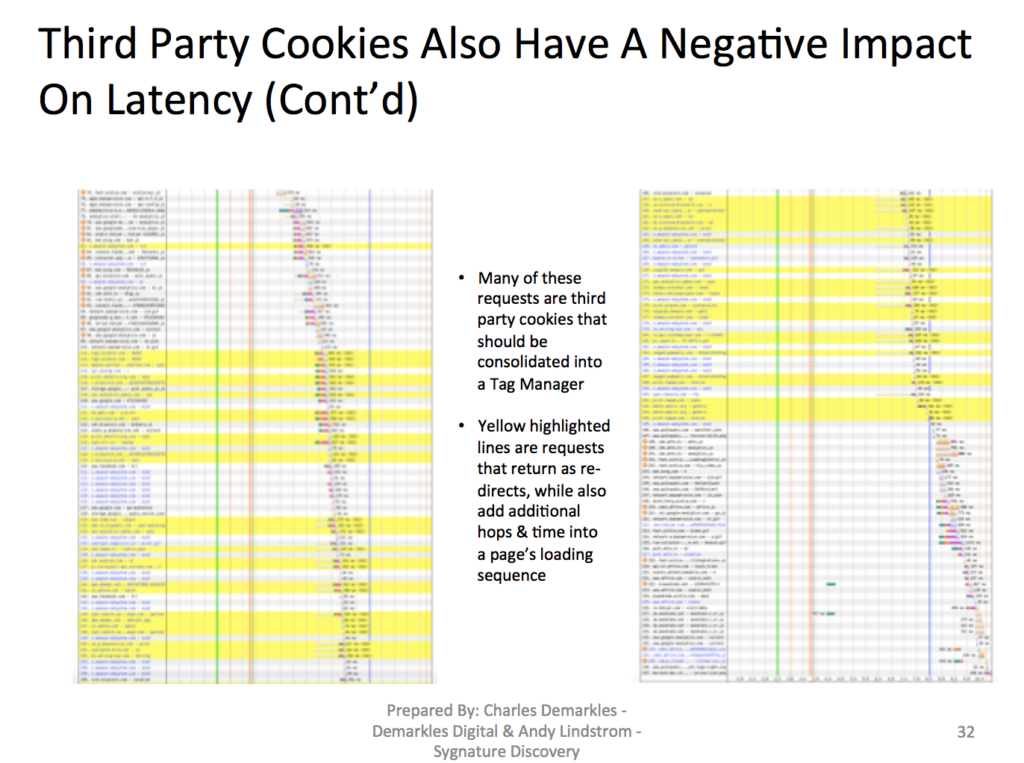
As you can see, the yellow highlighted rows are redirected files, and can eat up a large portion of a site’s loading time. These additional hops required to load a page drag down performance dramatically when you factor in the compounding of multiple requests.
This is part of why Chrome will no longer be supporting third party cookies anymore.
Tying It All Together
There’ll be follow up posts as the discussion was an hour & a half, but the primary themes for focus is on reducing the number of requests required to load a page, and grouping/compressing all requests to be relayed as efficiently as possible. The first thing to do is to assess what is taking place in your page loading sequence & identifying who is responsible for what resources.
Assessing the bytes/request ratio is essential & looking for ways to compress all packet sizes & request numbers is vital for having fast performing web pages. This helps to provide the user with a better experience, facilitates more touch points from a conversion rate optimization perspective, and improves rankings. Additionally, it also enables your site to be featured on a wider variety of SERPs as it is able to compete across more network connections.
Moving forward, having fast functioning webpages will become more & more vital – be sure that your site stays ahead of the curve!
For Full PDF File: