By now, all webmasters & marketers know that the speed of their pages loading is critical. Yet so many sites still fail to load quickly & efficiently. Our last post outlined some of the common issues with page load speed & latency, today we will give an overview of how to read & use the information from one of our favorite tools, WebPageTest.org.
What Does WPT Tell Marketers About Latency?
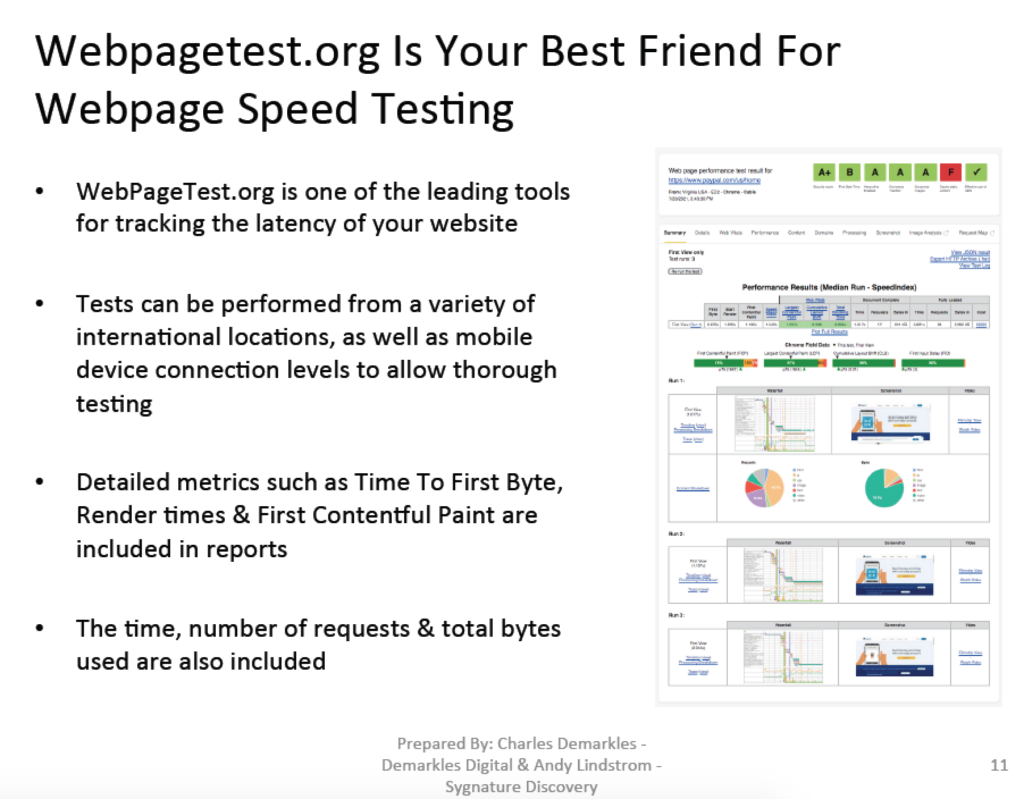
WPT test results provide some of the most useful data around page load speed out there. Tests can be run from different locations, which is important for geo-targeted campaigns & content. They also can be ran using a variety of mobile network connections, including 4G, Fast 3G, Regular 3G & Slow 3G connections.
This control enables webmasters to understand how their content can load by target audiences not only by their location, but by the common mobile network constraints that may be faced by certain geo-locations.
An example would be how certain countries have better access to wireless networks than others. If you were targeting an audience in a slower-connectivity country you would want to test not only the speed from a local desktop connection, but also from a mobile connection that is similar to the average mobile user in that location.
Breaking Down The Common Web Page Load Speed Metrics In WPT Reports
Before you plug a URL into WPT.org, it is important to understand what the output results will mean. Sometimes this can be overwhelming with the amount of data that is given, so I will break down some of the data here.
The top level of the test output is handy as it gives a high level score of many important fields that are related to your page’s load time.
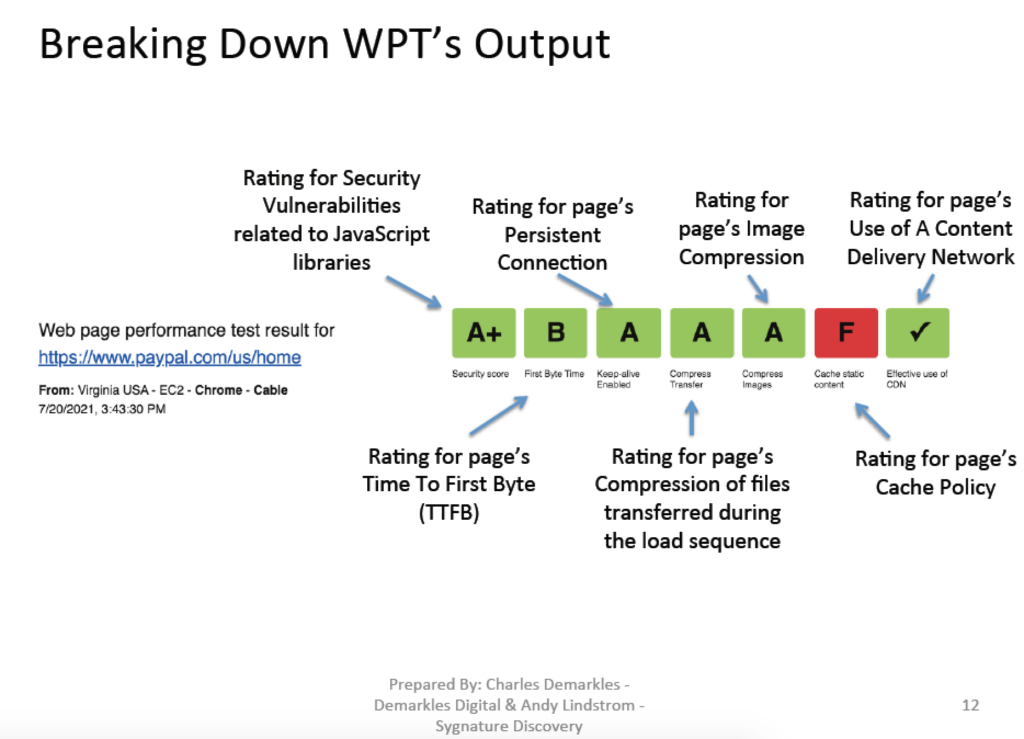
These letter grades are easy to read, making them great for high level discussions. Using these items to guide your presentations helps your audience visualize the more difficult to tackle concepts.
Each item can also be clicked on for additional detail. Marketers can now even see security ratings in addition to common latency issues.
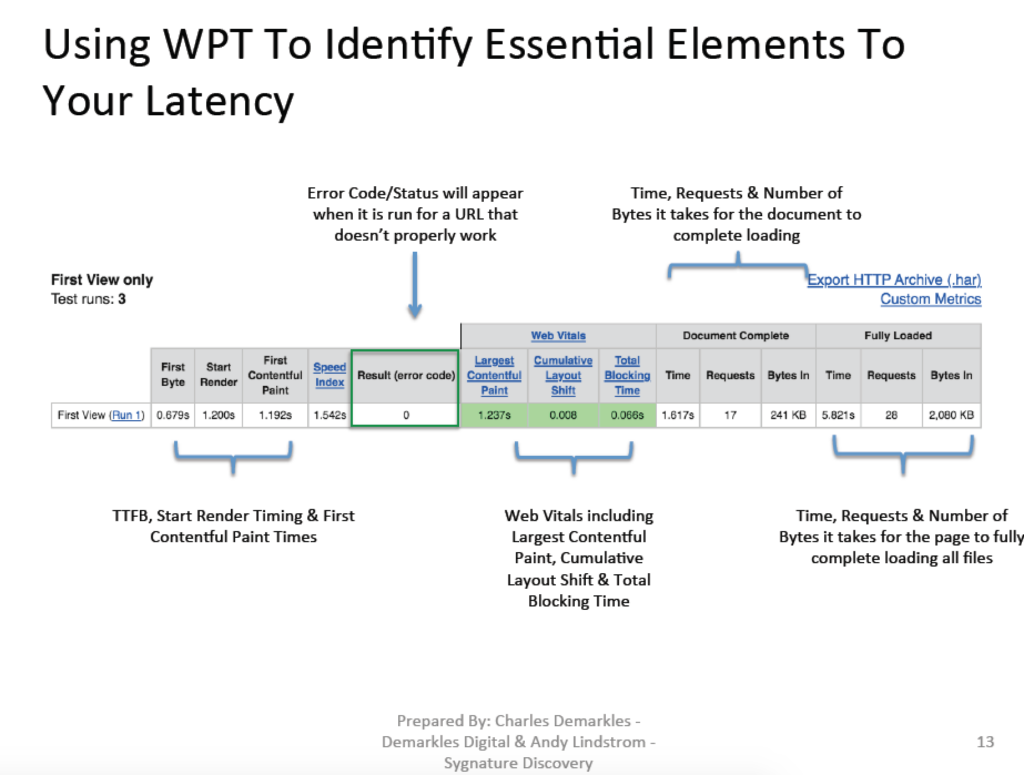
Time metrics are provided in the next section, shown above. The first portion of metrics deals with the pre-render file sequence. Files that return error codes will have their status code included (green box). The Web Vitals section uses Google Lighthouse data, which can be combined with their Page Speed Insights report output.
Webmasters want to look for ways to get more files loading after the initial rendering for fastest results.
This can be done by looking at the Document Complete vs. Fully Loaded sections. Ideally, this can be done by using Lazy Loading for anything not needed above the fold.
As always, the less requests that transfer the least amount of Bytes to load will be best.
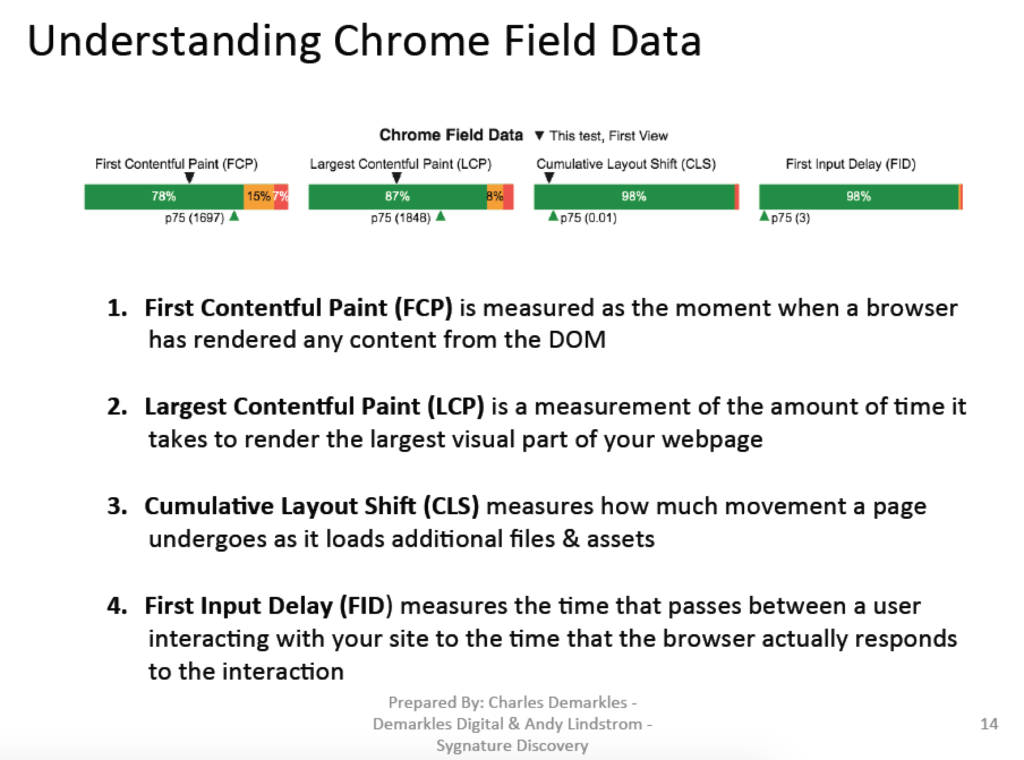
The addition of the Chrome Lighthouse Data is especially helpful for newer marketers trying to understand how Page Load Speed works. Users can run tests on both platforms, using the Google PSI for specific recommendations, with the WPT output for actually seeing the layout of what is happening.
This enables webmasters to have more control over how items load in their file sequences.
Tying It All Together
Overall, WPT is the most important tool for experienced webmasters dealing with latency. Their implementation of PSI data provides a nice bridge for inexperienced marketers to use. Understanding how these reports work is key to bridging the gaps in many internal conversations about page load speed.
One of the biggest advantages to WPT is that it provides individual numbers for each page resource. This enables marketers to model out real expectations in their ROI projections. The more accurate these projections are, the easier it is to pass along these & other initiatives.
Check back soon for more breakdowns into how webpage’s load & how to improve their speed!